

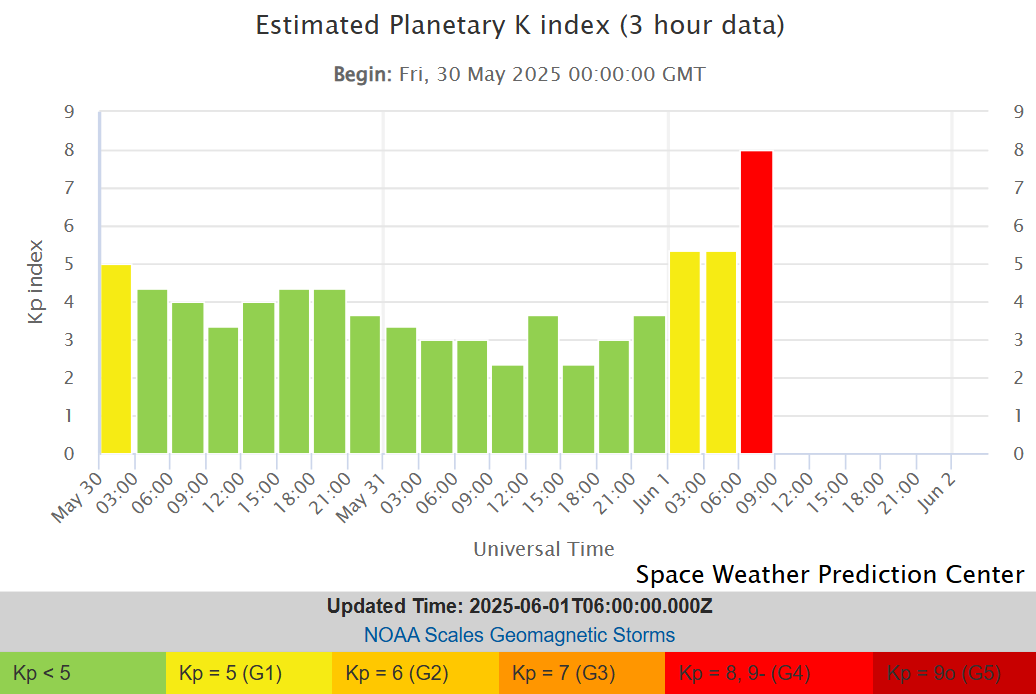
On June 1, 2025, Earth experienced a severe G4 geomagnetic storm, a powerful space weather event that captivated millions with stunning auroral displays while raising concerns among scientists and infrastructure operators. This storm, driven by a coronal mass ejection (CME) from the Sun, reached a planetary Kp index of 8, marking it as one of the most intense geomagnetic events in recent years. Reported by the National Oceanic and Atmospheric Administration (NOAA) and widely discussed on platforms like X, the storm’s effects were felt globally, from auroras lighting up unexpected southern locations like California and New Mexico to minor disruptions in GPS and radio communications. This article delves into the science behind the storm, its impacts on modern technology, its historical context, and the awe-inspiring natural spectacle it created.
The Science of a G4 Geomagnetic Storm
A geomagnetic storm occurs when charged particles from the Sun, carried by the solar wind, interact with Earth’s magnetic field. These events are classified on the G-scale by NOAA, ranging from G1 (minor) to G5 (extreme). A G4 storm, like the one on June 1, 2025, is considered severe, capable of causing significant disruptions to power grids, satellites, and navigation systems. The storm’s intensity is measured by the planetary Kp index, which ranges from 0 to 9. A Kp of 8, as recorded during this event, corresponds to a G4 storm, indicating strong geomagnetic activity.
The June 1 storm was triggered by a coronal mass ejection, a massive expulsion of solar plasma and magnetic fields, detected by the GOES CCOR satellite on May 31, 2025. CMEs are often associated with solar flares, and in this case, the eruption originated from a long-duration M-class flare in Region 4100 on the Sun, accompanied by an entangled filament eruption. According to space weather expert Tamitha Skov, the CME was a full halo event, appearing as a ring surrounding the Sun in coronagraph images—a clear sign it was Earth-directed. Full halo CMEs make up only about 4% of all CMEs, with roughly 10% being partial or full halo events, as noted in coronal mass ejection research on Wikipedia.
The CME traveled at a blistering speed, with solar wind speeds exceeding 1000 km/s—far above the average of 300–500 km/s. This rapid transit, initially forecasted to arrive by midday June 1, accelerated the storm’s impact on Earth’s magnetosphere. NASA’s Solar and Heliospheric Observatory (SOHO) provided coronagraph imagery via its LASCO instrument, confirming the CME’s size and trajectory. STEREO-A, another NASA spacecraft, offered a secondary perspective, further validating the Earth-bound path. The Deep Space Climate Observatory (DSCOVR) satellite at the L1 Lagrange point detected the CME’s arrival through sudden increases in solar wind density and magnetic field strength.
The storm’s severity was amplified by the CME’s magnetic field orientation, particularly its south-directed component. This orientation enhanced magnetic reconnection with Earth’s magnetosphere, a process where magnetic field lines break and reconnect, releasing terawatts of energy into the upper atmosphere. This energy fueled the aurora and drove the geomagnetic disturbances, as explained by NOAA’s Space Weather Prediction Center. The storm’s early escalation from G3 to G4 conditions caught some operators off guard, highlighting the challenges of predicting space weather with precision.
Auroral Displays: A Global Spectacle
One of the most striking effects of the June 1 geomagnetic storm was the widespread visibility of the aurora borealis, or northern lights, in regions far south of their typical range. The auroral oval, a band of auroral activity usually centered around 67–68 degrees geomagnetic latitude, expanded significantly during the storm, making the aurora visible in places like California, Texas, Oklahoma, and even New Zealand in the Southern Hemisphere. According to the Geophysical Institute at the University of Alaska, this expansion occurs during strong geomagnetic storms as charged particles penetrate deeper into Earth’s atmosphere.
The aurora’s vibrant colors—green, red, blue, and purple—resulted from the interaction of solar particles with atmospheric gases. Oxygen at around 60 miles altitude emits green light, while higher-altitude oxygen at 200 miles produces red. Nitrogen contributes blue and purple hues, as detailed in aurora forecast data. Photographs of the aurora often show more red than is visible to the naked eye due to camera sensitivities, a phenomenon noted by the Geophysical Institute. Social media platforms like Aurorasaurus and live aurora cameras, such as the Poker Flat DASC in Alaska, helped enthusiasts track the displays in real time, with reports confirming visibility even through cloud cover in some regions.
The storm’s timing coincided with the start of Pride Month, leading to humorous posts on X linking the aurora’s rainbow-like colors to Pride symbolism. One user, Scott Montgomery, shared an image of a figure painting a doorway with rainbow colors, drawing a playful parallel to historical storm lore and biblical imagery. The aurora’s global reach, from North America to Europe and the Southern Hemisphere, made it a unifying natural spectacle, with X users sharing photos and experiences of the rare event.
Historical Context: Learning from Past Geomagnetic Storms
The June 1, 2025, storm, while significant, is not without historical precedent. The 1859 Carrington Event remains the benchmark for extreme geomagnetic activity. With an estimated Dst index of -850 nT, the Carrington storm caused auroras as far south as Mexico and disrupted telegraph systems across North America and Europe, even starting fires and shocking operators. A 2019 study using the Weibull distribution estimated a 0.46% to 1.88% chance of a similar event occurring in the next decade, underscoring the potential for catastrophic impacts in today’s technology-dependent world.
More recent events provide additional context. The 1989 geomagnetic storm, with a Dst of -589 nT, collapsed the Hydro-Québec power grid in seconds, leaving six million people without power for nine hours. Auroras were visible as far south as Texas and Florida, mirroring the 2025 storm’s southern reach. The 2000 Bastille Day event, with a Dst of -301 nT, was less destructive, causing no reported power outages despite its strength, thanks to improved grid protections. The 2024 G5 storm, the first since 2003, temporarily knocked out power in Sweden and damaged transformers in South Africa, highlighting ongoing vulnerabilities.
The 2025 storm’s estimated Dst, while not explicitly reported, likely falls between the 1989 and 2000 events in intensity, given its G4 classification. Unlike historical events that primarily affected telegraphs, modern geomagnetic storms pose risks to satellites, GPS, and power grids, reflecting society’s increased reliance on technology. A Carrington-class storm today could cause trillions of dollars in damage, potentially leading to months-long blackouts, as warned in a 2008 Metatech study.
Technological Impacts and Vulnerabilities
The June 1, 2025, storm prompted warnings for potential disruptions to critical infrastructure, though no widespread power outages were reported. Geomagnetically induced currents (GICs), caused by magnetic field fluctuations, can overload transformers and cause blackouts, particularly in long transmission lines. High-voltage, low-resistance lines in North America, China, and Australia are especially vulnerable, while Europe’s grid, with shorter circuits, is less susceptible, according to geomagnetic storm research on Wikipedia.
Utility operators in 2025 were better prepared than in 1989, taking preemptive measures like reducing grid loads to mitigate transformer damage. The storm’s impact on the ionosphere increased free electron density, particularly in polar regions, leading to polar cap absorption events that disrupted radio communications. Amateur radio operators reported noisy conditions on both dayside and nightside bands, with periodic outages due to ionospheric interference. Long-distance radio transmissions, which rely on ionospheric bounce, were particularly affected.
GPS signals, critical for precision farming, aviation, and UAV operations, were scrambled by ionospheric disturbances. Tamitha Skov noted that such disruptions are common during geomagnetic storms, as the ionosphere’s charged particles interfere with signal propagation. Satellites faced risks from solar energetic particles accelerated by CME-driven shocks, which can damage electronics and degrade solar panels. Operators actively monitored spacecraft health, reflecting lessons learned from past events like the 2003 G5 storm.
The storm’s effects on navigation systems were brief but notable, aligning with NOAA’s Space Weather Scales. The increased electron density in the D-region of the ionosphere enhanced radio wave absorption, particularly in high-latitude regions, causing challenges for global communications. While the storm’s impacts were mitigated by proactive measures, they underscored the vulnerabilities of modern infrastructure to space weather events—a concern absent during the 1859 Carrington Event.
Advances in Space Weather Forecasting
Space weather forecasting has come a long way since the 1859 Carrington Event, when the connection between solar activity and geomagnetic storms was not fully understood. The June 1, 2025, storm’s G4 watch was issued with high confidence by NOAA’s Space Weather Prediction Center, reflecting advanced detection capabilities. Satellites like SOHO, STEREO-A, and DSCOVR provided real-time data on the CME’s trajectory, speed, and magnetic field orientation, enabling timely forecasts.
The Kp index, derived from global magnetometer measurements, is a key tool for predicting auroral activity and geomagnetic storm impacts. However, local magnetometer measurements, such as those from the GIMA chain in Alaska, often provide more accurate real-time aurora predictions, as the Kp index is a global average. Auroral substorms, distinct from global geomagnetic storms, drive nightly auroral activity and are better indicators for aurora chasers in specific regions, per aurora research.
Computer simulations have also advanced space weather research. By solving magnetohydrodynamic equations, scientists can model the magnetosphere’s response to solar wind variations. At polar regions, large-scale ionospheric anomalies can be accurately modeled, though smaller-scale variations (on the order of a degree of latitude/longitude) remain challenging to predict. The OVATION model, used to forecast auroral oval expansion, helped predict the 2025 storm’s southern visibility, while tools like the Poker Flat DASC camera enhanced real-time monitoring.
The Sun’s Role: Solar Cycle 25 in Full Swing
The June 1, 2025, storm occurred during the peak of Solar Cycle 25, an 11-year cycle that governs the Sun’s magnetic activity. Near solar maxima, like in 2025, the Sun produces about three CMEs daily, compared to one every five days near solar minima, according to Wikipedia data. The solar dynamo, a process in the Sun’s interior, generates magnetic fields that rise to the surface, forming active regions that fuel CME eruptions. The 2025 storm’s CME originated from twisted magnetic field structures in the Sun’s corona, which erupted through magnetic reconnection—a process where magnetic fields realign, releasing vast amounts of energy.
CMEs near solar maxima are often more frequent and intense, as seen with the 2025 storm’s full halo event. The CME’s speed, initially 1,200 miles per second, slowed as it traveled, a typical dynamic of CME propagation. Shocks driven by fast CMEs, like this one, form as low as 2 solar radii and are linked to type II radio bursts, per Wikipedia’s CME research. The average mass of a CME is 1.6×10^12 kg, though this is a lower limit since coronagraphs provide only two-dimensional data, underestimating total mass.
CMEs can interact with each other in space, a phenomenon called CME cannibalism, potentially increasing their impact on Earth. The 2025 storm’s CME was part of a series of eruptions, with two or three solar structures potentially impacting Earth, as noted by Tamitha Skov. Voyager 1 and Voyager 2 observed the 2000 Bastille Day storm, marking the farthest recorded detection of a solar storm in the Solar System, a testament to the reach of such events.
Social and Cultural Reactions
The 2025 storm’s auroral displays sparked a wave of social media engagement, with X users sharing photos, videos, and reactions. The hashtag #SolarCodes trended as users like @PowerWithin369 speculated on the storm’s deeper significance, describing it as a “global recalibration” and an “activation” tied to human consciousness. Others, like @montyinthebank, tied the aurora’s colors to Pride Month, while @IterIntellectus shared a meme of a person staring at a fiery Sun, humorously capturing the awe and anxiety of the event.
Some users expressed skepticism or indifference. @moonstatzdismissed the storm as “fake and gay,” while @Mellowhyped__quipped, “Unless we get a day off tomorrow I don’t even care anymore.” Others raised concerns about climate change (@oida_grantler) or questioned the storm’s severity (@Chching_asking, “Are we all dead now?”). The mix of awe, humor, and concern reflected the diverse ways people processed the event, from scientific curiosity to cultural symbolism.
Looking Ahead: Preparing for Future Storms
The June 1, 2025, storm was a reminder of both the beauty and power of space weather. While it caused no major power outages, its effects on GPS, radio communications, and satellite operations highlighted the vulnerabilities of modern infrastructure. As Solar Cycle 25 continues, more geomagnetic storms are likely, with the potential for even stronger events. A Carrington-class storm today could cause trillions of dollars in damage, a scenario that underscores the need for continued investment in space weather research and infrastructure resilience.
Advancements in forecasting, satellite monitoring, and grid protections have mitigated some risks, as seen in the 2025 storm’s relatively minor impacts. However, challenges remain, particularly in predicting smaller-scale ionospheric variations and preparing for rare but catastrophic events. The storm’s auroral displays, visible across continents, were a rare spectacle, reminding humanity of the Sun’s profound influence on Earth. As we navigate the peak of Solar Cycle 25, the June 1, 2025, G4 geomagnetic storm serves as both a warning and a wonder—a call to prepare for the Sun’s fury and a chance to marvel at its beauty.